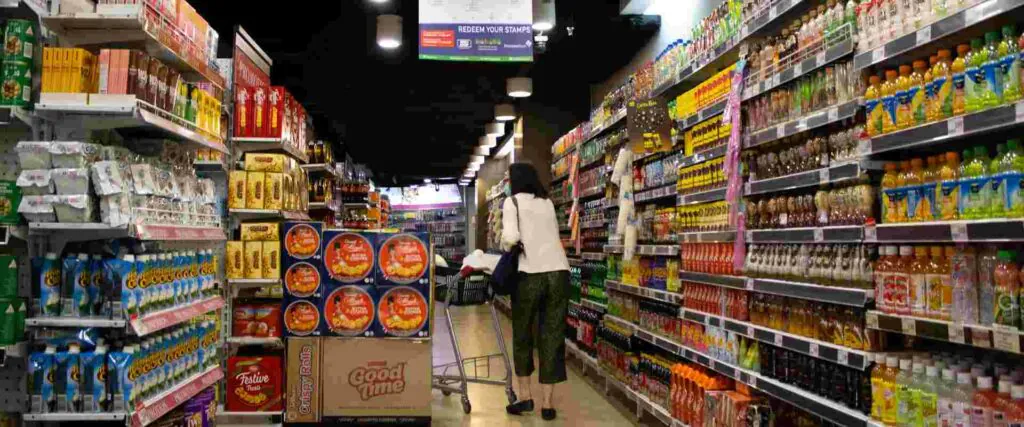
In the consumer packaged goods (CPG) industry, effective data visualization and CPG DATA TRENDS is key to smart tracking and analysis. CPG companies face immense data from diverse sources, making it challenging to derive actionable insights without robust visualization tools. Implementing the right data visualization practices is essential for gaining a clear understanding of these complex datasets.
Table of Contents
Benefits of CPG Data Visualization:

One of the primary advantages of using advanced visualization tools is improved decision-making. Visualization tools transform raw data into intuitive charts and graphs, facilitating better business decisions across departments. These visual aids make patterns easier to spot, helping leadership respond swiftly to changes.
Enhanced operational efficiency is another significant benefit. Through automation and smart data visualization practices, businesses can streamline processes, saving valuable time and reducing the chances of manual errors. Automated visual analytics ensure that teams spend less time collecting data and more time interpreting it.
Access to real-time insights through effective data visualization tools enables businesses to promptly address market changes and shifts in consumer behavior. Real-time visual dashboards ensure teams are equipped with the latest data, which leads to faster response times and better alignment with business goals.
Increased market understanding is achieved as visual tools clearly highlight market trends and consumer preferences. Through consistent data visualization, companies can enhance their strategic planning and marketing efforts by making data more accessible and understandable.
Better collaboration across departments becomes possible when data is presented in a visual format. Easy-to-understand visual data fosters communication and alignment among teams, leading to cohesive strategies and improved business outcomes. Implementing collaborative data visualization practices empowers different stakeholders to engage with insights effectively.
Ways to Enhance CPG Data Visualization:
To maximize the value of visual analytics, it’s important to leverage advanced analytics capabilities. By integrating cutting-edge data visualization, businesses can convert complex data sets into clear visual formats, ensuring a more comprehensive and digestible analysis.
Implementing real-time data tracking solutions is crucial. These solutions, built on strong data visualization techniques, help companies stay updated with the latest market dynamics, supporting timely business interventions and adaptations.
Automating data integration is another way to improve visualization efforts. By using reliable data visualization tools that incorporate automated integration, businesses can streamline information from multiple sources, reducing manual intervention and the risk of errors.
Focusing on user-friendly interfaces is key to encouraging widespread adoption of data tools. With intuitive and easy-to-navigate platforms, businesses can ensure that data visualization practices are embraced across departments, regardless of technical proficiency.
Lastly, investing in scalable solutions is essential. Scalable visualization tools allow businesses to grow and adapt their analytics capabilities as data volumes and complexity increase. Scalable data visualization processes help companies stay agile in a fast-paced market environment.
Incorporating advanced CPG data visualization solutions can revolutionize how companies track and analyze data. By leveraging these tools, businesses can make informed decisions, enhance efficiency, and better understand market trends. Quantzig’s comprehensive data visualization solutions is tailored for the CPG intelligence industry, ensuring efficient data tracking and strategic insights for sustained growth.


