Author: Associate Vice President, Analytics and Data Strategy, Quantzig.
Table of Contents
Introduction to Visualization in Data Analytics
When it comes to successfully positioning your organization in the competitive market, data analytics and visualization act a key ingredient. Data visualization using appropriate data analysis methods can provide valuable insights into business operations. Such insights can be incorporated by businesses in the decision-making pipeline to make data-driven decisions. Leveraging such data analytics and visualization solutions can help companies to analyze their data irrespective of the size, scale, type, and domain and improve their decision-making capabilities.
Data analytics and visualization have become a necessity for companies to manage risks and comply with the changing regulatory landscape. In this article, we have highlighted how data analytics and visualization techniques can be utilized to make the most of the statistical data, old experiences/learnings, and fresh ideas to launch new products.
Book a demo to experience the meaningful insights we derive from data through our analytical tools and platform capabilities. Schedule a demo today!
Request a Free Demo
What does data visualization mean?
Data visualization is a powerful tool for transforming complex data into meaningful and actionable insights. By leveraging graphical elements such as charts, graphs, and maps, data visualization enables the effective communication of information, making it accessible to both technical and non-technical audiences. In the era of Big Data, where vast volumes of information are generated at an unprecedented rate, the importance of data visualization cannot be overstated.
The Role of Visualization in Data Management:
Data visualization plays a crucial role in analyzing and interpreting large datasets. It allows users to identify trends, patterns, and anomalies that may not be readily apparent in raw data. By presenting information in a visually appealing and intuitive manner, data visualization facilitates the understanding of complex relationships and enables informed decision-making processes.
Data Visualization: Importance
The importance of the modern-day implications of businesses stand a little different than what we have witnessed so far. Here are some of the importance that had helped data visualization stand out in recent times:
- Data visualization simplifies data comprehension by enabling viewing, interaction, and understanding. It fosters alignment among individuals of varying expertise levels, ensuring everyone comprehends the data insights.
- Virtually every professional sector benefits from enhanced data comprehension, spanning STEM fields, government, finance, marketing, history, consumer goods, services, education, and sports.
- Mastering data visualization is highly advantageous in the professional realm, as it enhances one’s ability to convey information visually.
- The rise of the citizen data scientist underscores the increasing value of professionals who can leverage data for decision-making and employ visuals to narrate data-driven stories.
In the modern professional world, proficiency in data visualization bridges the gap between analytical prowess and visual storytelling, making individuals who can navigate both domains highly valued. However, raw data can pose challenges in terms of comprehension and usability. To address this, data scientists contextualize and present data in a visually accessible manner. By transforming data into visual representations, they enable decision-makers to discern connections within the data and uncover concealed patterns or trends. Through data visualization, narratives are crafted that propel business intelligence forward, aiding in data-driven decision-making and strategic planning.
What are the advantages of data visualization: Data visualization best practices
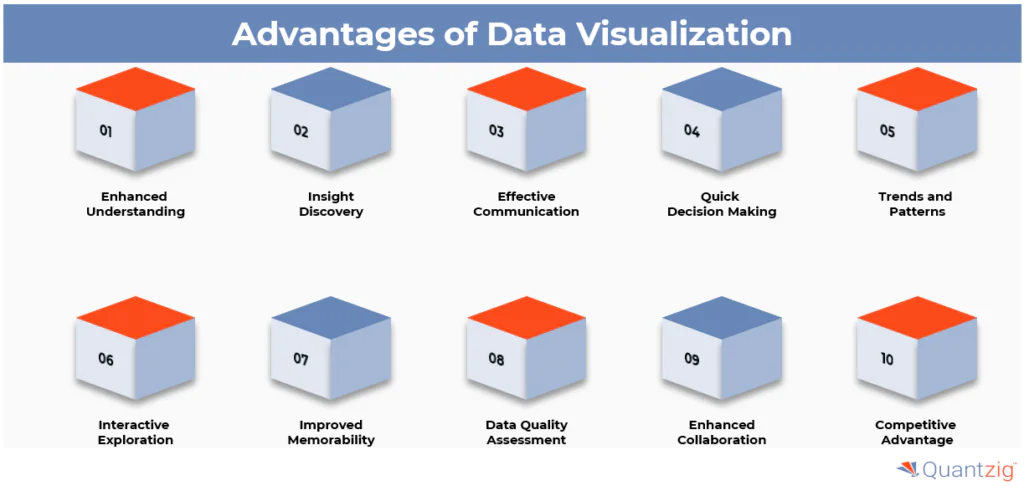
Data visualization offers numerous advantages:
- Enhanced Understanding: Open source visualization tools representations make complex data more accessible and understandable, providing comprehension of trends, patterns, and relationships.
- Insight Discovery: Visualization enables the identification of insights and correlations that might not be immediately visible via raw data, leading to more informed decision-making.
- Effective Communication: Visualizations and Open source visualization tools serve as powerful communication tools, enabling the efficient sharing of findings and insights with stakeholders, regardless of their technical expertise.
- Quick Decision-Making: By presenting information visually, data visualization propels the decision-making process by providing clear, concise, and actionable insights.
- Identification of Trends and Patterns: Visualization tools make it easier to identify trends, outliers, and patterns within data, helping organizations to capitalize on opportunities and address potential issues promptly.
- Interactive Exploration: Many data visualization tools offer interactive features, allowing users to explore data from different angles, drill down into details, and customize views according to their requirements.
- Improved Memorability: Visual representations are often more memorable than textual or numerical data, making it easier for individuals to retain key information and concepts.
- Data Quality Assessment: Visualization can aid in the detection of data inconsistencies, outliers, and errors, helping organizations to improve data quality and reliability.
- Enhanced Collaboration: Visualizations encourage collaboration among team members by providing a shared understanding of data, encouraging discussions, and promoting an aim towards common goals.
- Competitive Advantage: Organizations who can effectively utilize data visualization have a competitive edge to leverage data-driven insights in optimizing processes, innovate products, and respond swiftly to market changes.
Experience the advantages firsthand by testing a customized complimentary pilot designed to address your specific requirements. Pilot studies are non-committal in nature.
Request a free trial nowTypes of data visualizations:
Data visualization encompasses various techniques beyond traditional charts and graphs. Understanding different types of data visualization methods can enhance the presentation and interpretation of data. Here are five key methods explained:
Temporal Data Visualization
Temporal data visualization focuses on representing linear, one-dimensional data like timelines or line graphs. These visuals are ideal for illustrating changes over time, with multiple lines showing variations across different factors within the same timeframe.
Hierarchical Data Visualization
Hierarchical data visualization organizes data into parent-child relationships, displaying clusters of related information. For instance, using a tree structure to show inventory quantities under parent categories like clothes, with child nodes for specific items like shirts, trousers, and socks.
Network Data Visualization
Network data visualization illustrates complex relationships between interconnected data points. Techniques like scatter plots, bubble charts, and word clouds help visualize correlations, patterns, and frequencies within datasets.
Multidimensional Data Visualization
Multidimensional data visualization presents multiple data variables in 2D or 3D formats, using visuals like bar charts, pie charts, and stacked bar graphs. These methods allow for comparisons, trends analysis, and showcasing proportions within datasets.
Geospatial Data Visualization
Geospatial data visualization ties data to real-world locations, utilizing tools like heat maps, density maps, and cartograms. These visuals provide insights into spatial patterns, such as customer distribution across different retail store branches.
By leveraging these diverse data visualization methods, analysts and decision-makers can effectively communicate insights, patterns, and relationships within datasets, leading to more informed decision-making and impactful presentations.
How Can Data Analytics and Visualization Help Businesses?

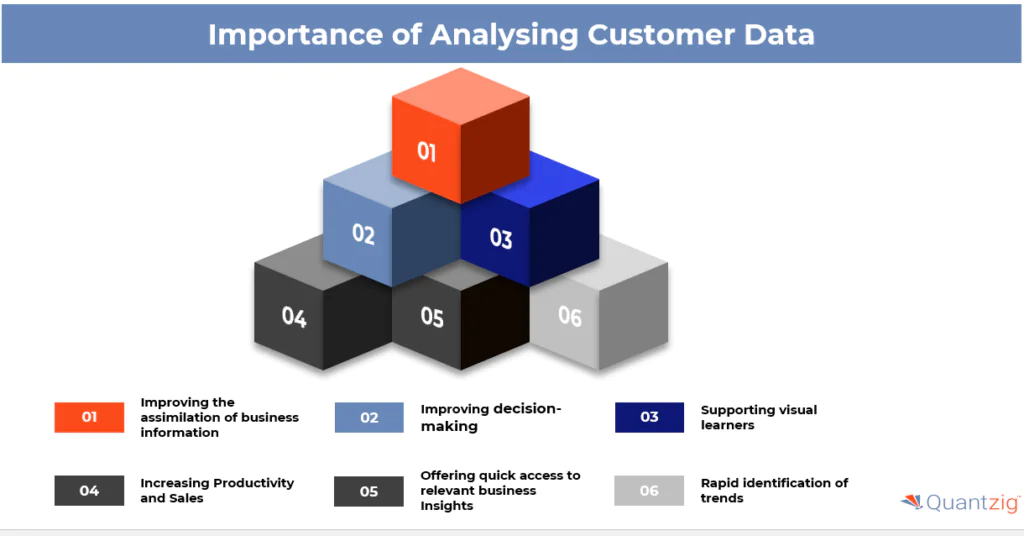
By improving the assimilation of business information
The human mind has the ability to grasp and absorb information more easily through images and visuals than numeric data and texts. Still, most business reports are typically populated with static charts and tables that fail to convey relevant information easily to the viewers. On the other hand, data analytics and visualization solutions enable users to grasp a huge amount of information regarding business operations easily and quickly. Data analytics and visualization techniques also allow decision-makers to identify relationships between multi-dimensional data sets and interpret data effectively using fever charts, heat maps, and various other graphical representations.
By improving decision-making
Companies who act quickly on their data tend to be more competitive in the marketplace because they can make better and more data-driven decisions sooner than the competitors. Data analytics and visualization techniques help in understanding big data by applying visual representations like Graphical representation to it. By using data analytics services, companies can discover and explore data in a self-service manner. Not only does this stimulate creativity, but it truncates the need for IT companies to allocate resources to build new data models continually.
By supporting visual learners through analytics dashboards
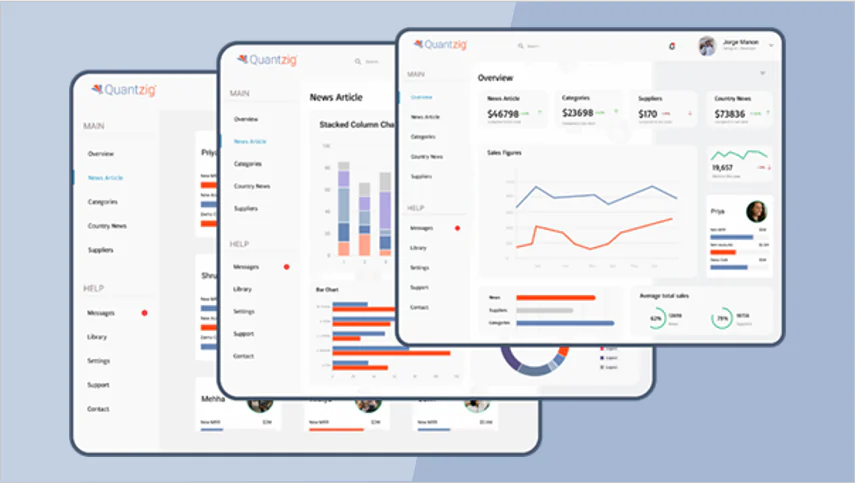
Data analytics and visualization tools like customized dashboards can help businesses to quickly comprehend the information presented in the form of visuals. Modern technology has moved ahead of the spreadsheet era and has transformed the way of presenting information from generic spreadsheets into appealing and easy-to-read graphs and charts. Analytics dashboards can offer actionable insights into business operations that may have been missed and help in creating actionable items, and ultimately, boost sales.
By increasing productivity and sales
Data visualization promises Data relationships to produce real results. Companies that apply proper data analysis methods are able to dig into the pool of data effortlessly and realize improvement in their bottom line. Data analytics, Data relationships and visualization techniques enable companies to analyze their market, sales, pricing, and customers by using strategic sources. Furthermore, this helps in understanding the next steps and take action accordingly. This leads to better productivity and significant improvement in sales.
By offering quick access to relevant business insights
By leveraging data analytics, Data-driven insights and visualization techniques, organizations can improve their ability to fetch relevant information from the pool of data. Recent research shows that businesses that use data visualization tools are much more likely to find relevant information than those who completely depend on managed reporting and dashboards.
By assisting in rapid identification of latest trends
In this era of technology, the availability of huge datasets can offer business leaders with Idea illustration and insights into new business and revenue opportunities. Businesses can gain a lot from this opportunity only if they have a proper data analysis method in place. By leveraging data analytics and visualization techniques, companies can grasp shifts in market conditions and customer behavior across multiple data sets faster with Idea illustration. By visualizing market trends by each quarter, by year, or by SKU, companies can get into the pulse of the market and take actions to reverse negative trends and benefit from positive trends.
Get started with your complimentary trial today and delve into our platform without any obligations. Explore our wide range of customized, consumption-driven analytical solutions services built across the analytical maturity levels.
Start your free trial nowWhat are the differences between Data Analysis and Visualization?
Data analysis and data visualization are both crucial components of the data science workflow, but they serve distinct purposes and involve different techniques:
| Aspect | Data Analysis | Data Visualization |
|---|---|---|
| Purpose | Examines raw data to extract insights and draw conclusions | Represents data graphically to aid understanding |
| Techniques | Statistical analysis, modeling, hypothesis testing | Charts, graphs, maps, dashboards, interactive features |
| Output | Numerical summaries, statistical measures, insights | Visual representations (charts, graphs, etc.) |
| Interpretation | Understanding statistical significance, drawing conclusions | Extracting insights from visual patterns and trends |
| Tools | Statistical software (e.g., R, Python), machine learning frameworks | Visualization libraries, BI platforms, programming languages |
| Example Applications | Regression analysis, clustering, classification | Scatter plots, bar charts, heatmaps, interactive dashboards |
While data analysis and data visualization are distinct processes, they often cross each other in practice, with visualization serving as a vital tool for exploring, validating, and communicating the results of data analysis.
Steps to select a data visualization software
When selecting data visualization software, several key factors must be considered to ensure optimal performance and integration with your existing infrastructure. Here are the essential criteria to evaluate:
Infrastructure Support:
- Integration: Ensure the chosen data visualization software seamlessly integrates with your existing IT infrastructure and databases.
- Third-Party Support: The tool should support multiple third-party data sources, allowing for direct import of external data when needed.
Interactive Reporting:
- User-Friendly: Interactive reports should be accessible to nontechnical users, enabling them to analyze big data and discover patterns without relying on technical teams.
- Dynamic Filtering and Sorting: Users should be able to filter, sort, and manipulate data variables within interactive charts to visualize data values.
Security:
- Access Control: The data visualization tool should have robust security features to limit access to unauthorized users and roles, preventing potential vulnerabilities in your business intelligence system.
Scalability:
- Handling Large Datasets: Choose a data visualization tool that can efficiently handle massive datasets.
- Machine Learning and AI: Opt for tools that incorporate machine learning (ML) and artificial intelligence (AI) capabilities to automate data visualization tasks at scale, ensuring efficient data analysis and visualization.
By considering these criteria, you can select the best data visualization software for your organization, ensuring seamless integration, effective data analysis, and robust security.
Conclusion
As more and more data visualization tools become available, it is crucial to make sure that visual communication is as successful as possible. Data visualization must be planned strategically and simplified in order to lead viewers to the desired insights or conclusions. In order to facilitate audience comprehension, background information that highlights the importance of data points must be included in order to build context. Furthermore, it is essential to comprehend the intended audience in order to customize visualizations to their unique requirements and goals, guaranteeing resonance and inspiring action inside their spheres of influence.
In addition, it is crucial to use graphics that are in line with the dataset and effectively communicate the primary lesson; otherwise, misunderstanding may result from misalignment. Reducing the amount of information in visualizations to what is necessary to maximize impact, concentrate audience attention, and enable insightful interpretation and decision-making. Data visualizations can successfully convey insights and produce actionable results by following these guidelines.


